$
Projects and traces. Named configurations as JSON files in the app data directory. Each trace is a self-contained graph with its own source and variables; several can stream simultaneously.
$
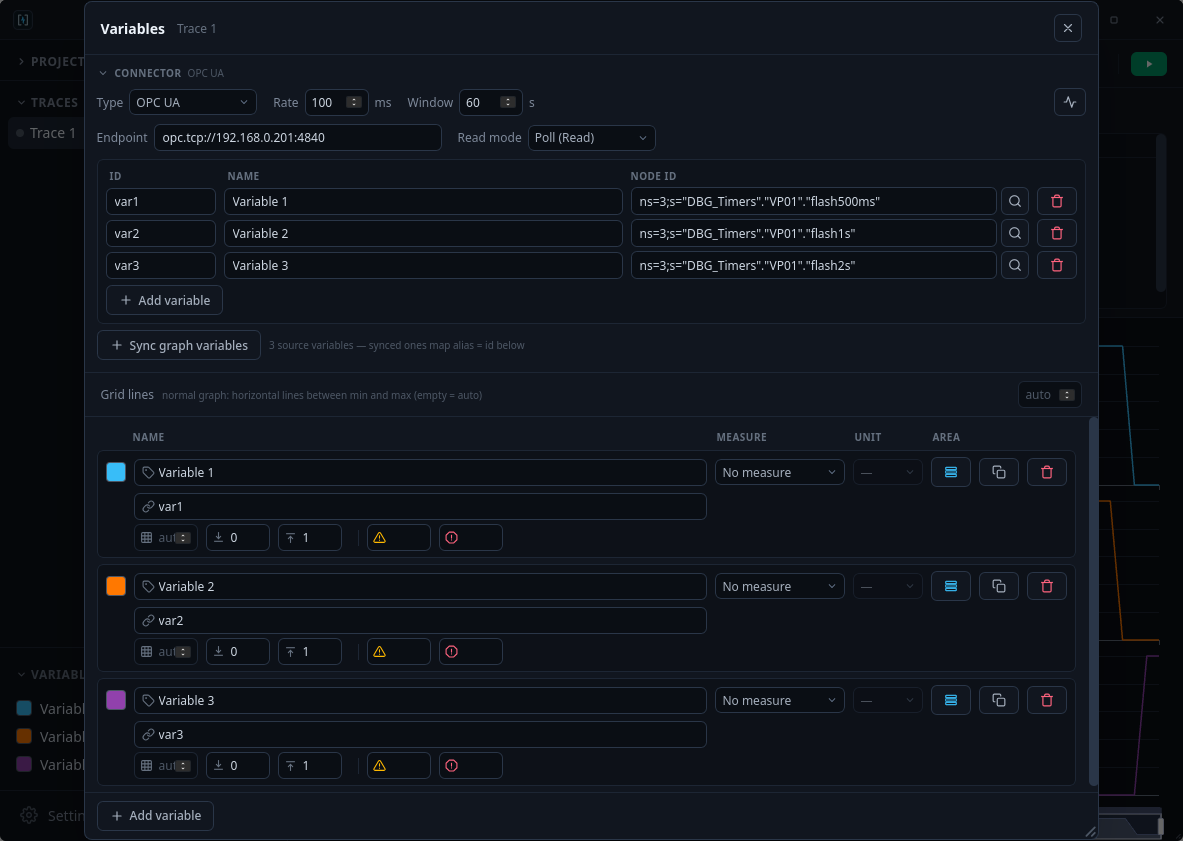
Four data sources. Simulation (7 process signals at 10 Hz — noisy sine, random walk, sawtooth, step, two on/off booleans), TCP/JSON (newline-delimited telegrams, dot-path fields, auto-reconnect), Siemens S7 (periodic DB reads over S7comm), OPC UA (batched poll or server-side subscription).
$
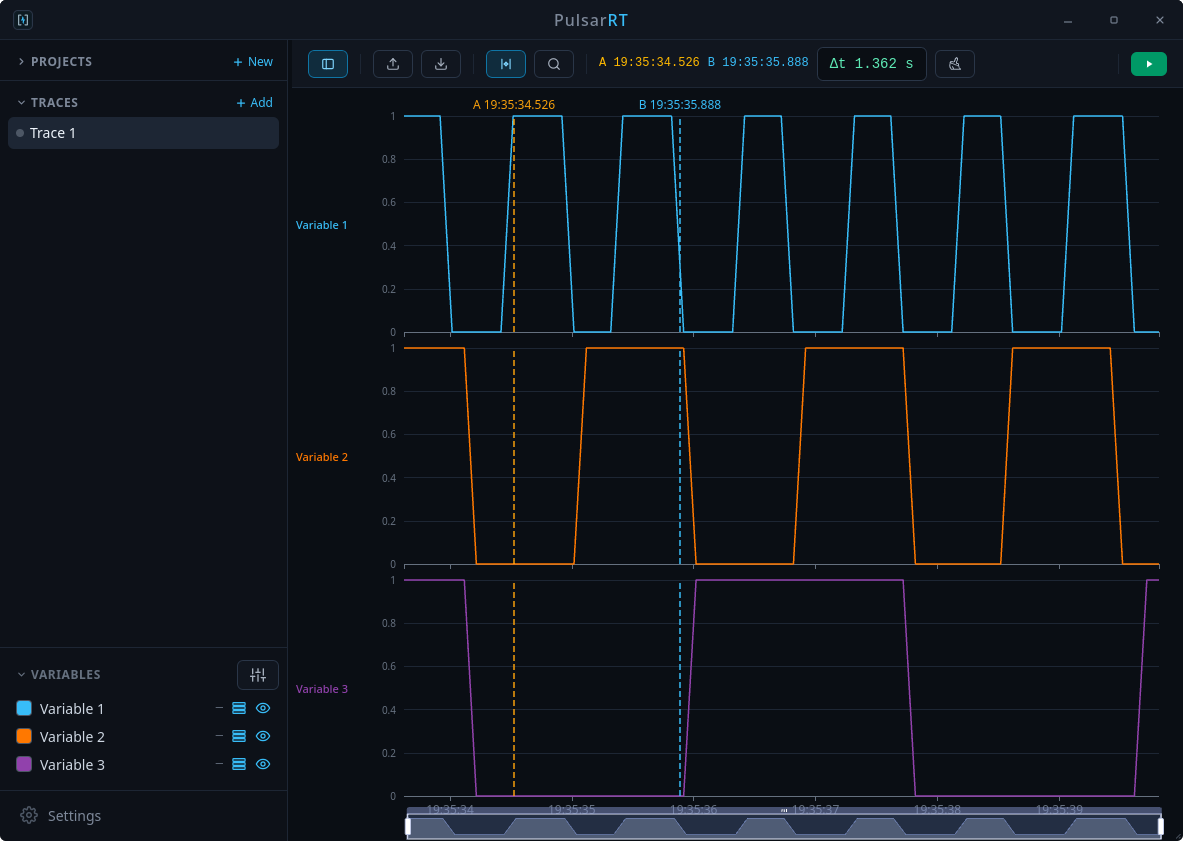
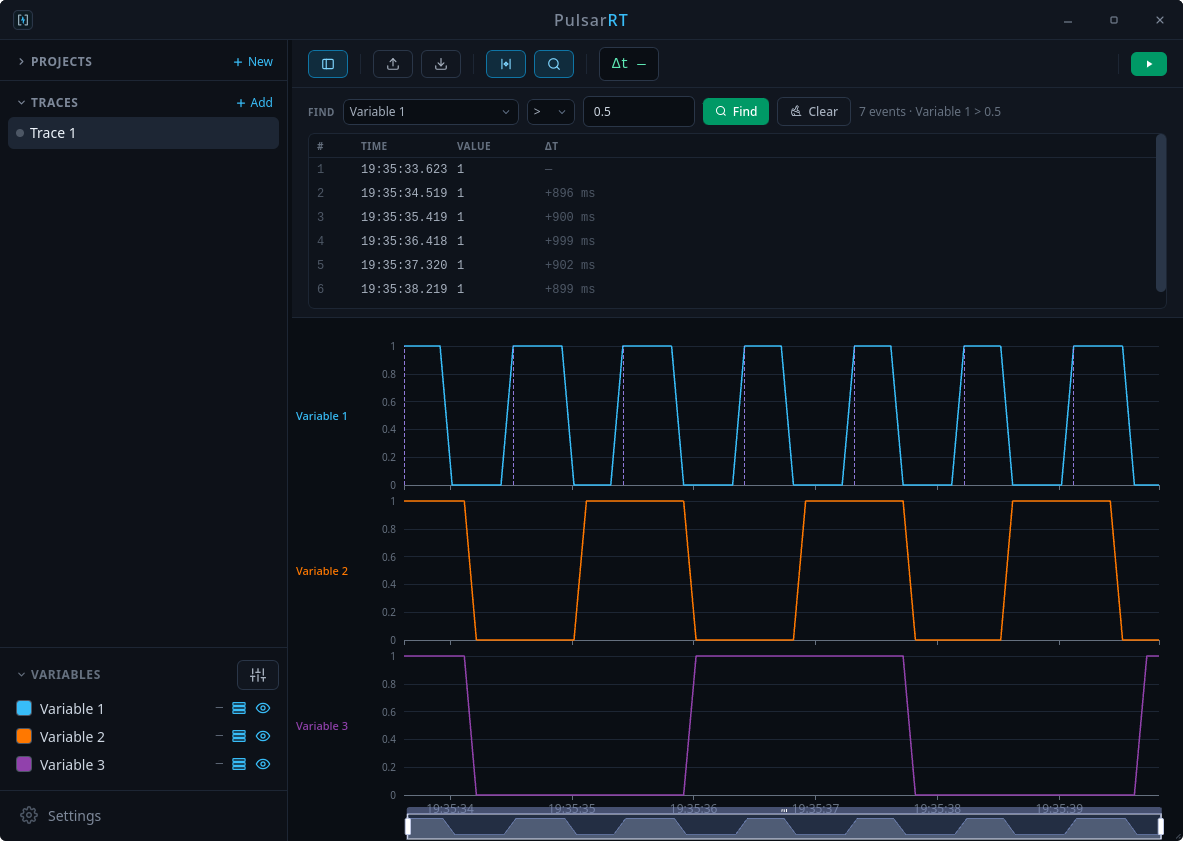
Timeline graph. An overview area and per-variable rows on one shared time line; one zoom drives both. Mouse-wheel zoom, drag, and a Follow button for when you drift off the live edge.
$
Measurement tool. Toggle Measure, click the chart twice: reference lines A and B, the time delta Δt in the top bar. Works on live data and on the last captured session.
$
Threshold alerts. Optional warn and crit per variable: dashed lines on the chart, amber/red flags in the list, a badge counting the alarming variables.
$
Measures and units. Eight seeded unit classes — Temperature, Pressure, Flow, Vibration, Rotation, Level, Electrical, Mass — per-variable unit and bounds; add your own.
$
OPC UA node browser. Drills the address space, remembers where you were; Use node copies the selected id into the editor.
$
In-app updates. Checks the Gitea releases feed, shows the release notes, downloads the installer in-app, hands over. AppImage on Linux, NSIS/MSI on Windows.